Telemetry, Dashboards and Insights
What is the measure of an Open Source community? How do we know if a project is nascent, dynamic, snoozing or moribund? Devs usually start by asking other devs about the reputations of a project and its contributors, and proceed to evaluate the project code itself as the real validation. But do objective measures exist for the quality, popularity and activity of an open source project?
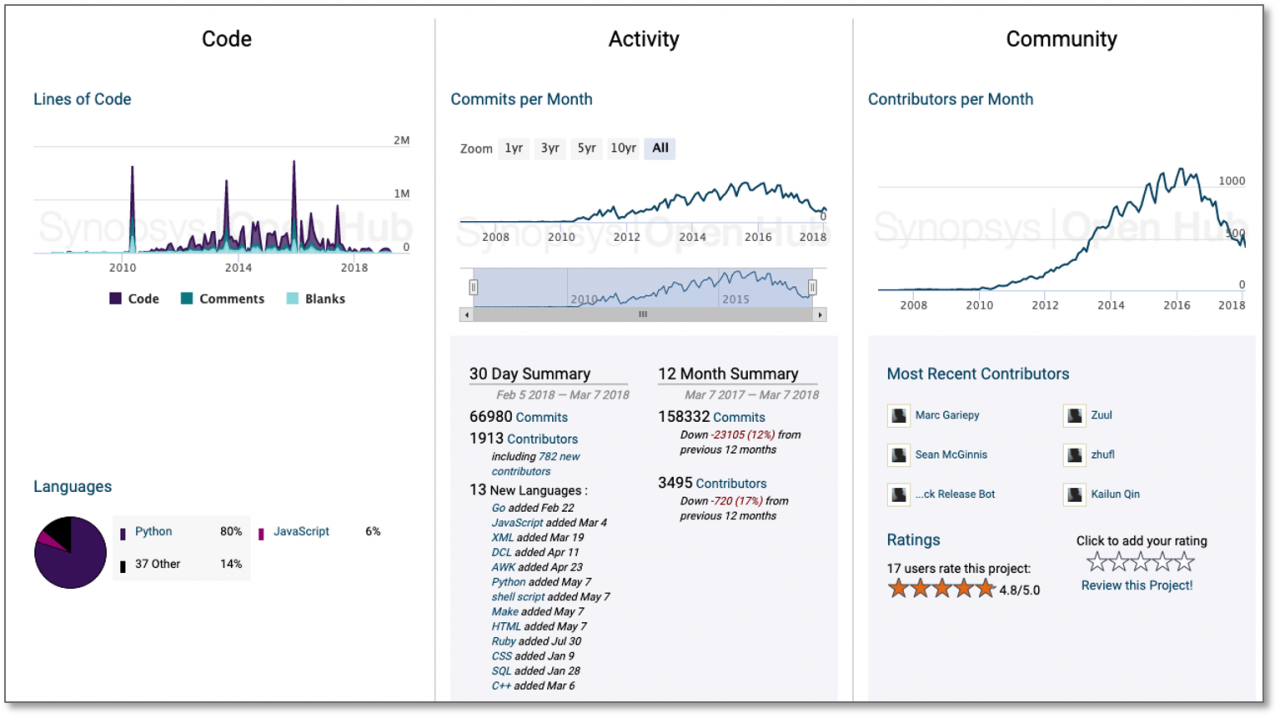
In many cases, project metrics already exist. Hosting sites and services like GitHub, GitLab and Bitbucket provide measures of project and community activity – code size, composition and history; developer info, community size and commit rates; open issues, resolution rates and backlogs. Third-party sites like Synopsys OpenHub gather comparable data across multiple projects and facilitate comparisons. Bitergia and the projects they sponsor let companies and communities build dashboards with highly customizable software development analytics for both open and closed software.
Focus on User Communities
Once a project emerges from incubation (in a community, at a company or a foundation), the great majority of community members will be users, not developers or maintainers. Users will comprise the lion’s share of a community for massive projects like the Linux kernel and for nascent ones like the OpenTAP.io Project. Anyone seriously considering deploying a project needs to understand the size and dynamics of the associated user base – the community of their peers.
Repository-based metrics can provide deep insights into the activities and dynamics of Open Source projects and the developer communities but tell little about actual users and usage. The ultimate test of project success lies in end-user adoption, which is much harder to measure. Historically, many projects have tracked secondary metrics like downloads and self-reported deployment, but these numbers have serious limitations – downloads can result in zero, few or myriad deployments; and self-reported usage usually misses the mark by orders of magnitude and is subject to gaming to boost portal rankings.
The Benefits of Telemetry
The most common (and least torturous) method for generating end-user metrics for any piece of software is with anonymized telemetry – data generated when users install, initialize and run the software in question.
Built into the code base of the OpenTAP Engine version 9.12 is the capability to generate and share the following fully anonymized information back to the OpenTAP Project:
An anonymized unique ID for the user on the installation machine
An anonymous ID representing a given installation on the machine (to differentiate among multiple local installations)
A manifest of packages included in the installation (package name and version, including plugins, transmitted as hash values)
Additionally, the OpenTAP Project will also record the IP address of a telemetry ping from the installation process.
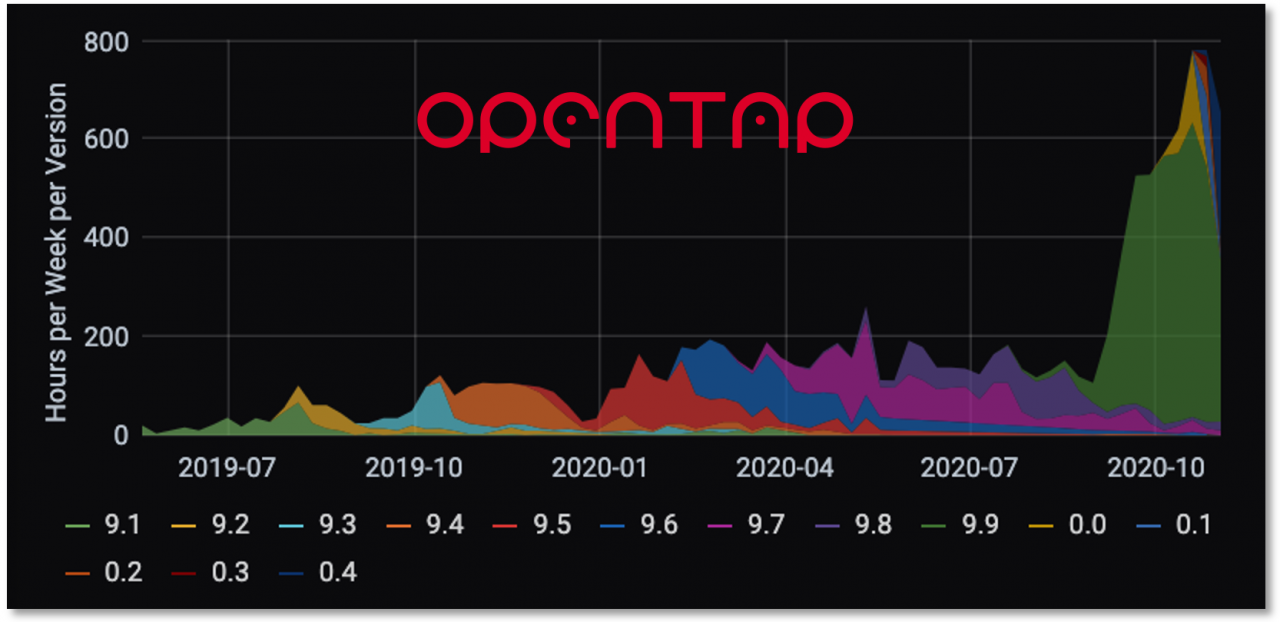
The OpenTAP Project will consolidate this gathered information and present it in a community dashboard open to the OpenTAP Community and to anyone considering deploying the OpenTAP Engine for test automation. Example dashboard metrics will be able to show actual OpenTAP Engine versions in use (see figure below), total active users, average weekly usage, popularity of plugins and other packages, and more.
The data will be 100% anonymized – only the aggregated metrics and trend data will be saved by the project and shared. Moreover, OpenTAP users can opt out of the telemetry program by rebuilding from source with a telemetry-specific build-time option disabled.
Everyone Benefits
OpenTAP usage data follows the path already taken with Keysight commercial offerings, and will bolster the value of the OpenTAP Project by providing definitive and transparent reporting of end-user adoption of the OpenTAP platform. By augmenting repository-centric project parameters, the telemetry-based dashboard will help prospective end-users and devs alike understand usage patterns and growth of OpenTAP adoption. More transparency means more adoption, and usage, in a virtuous cycle.
We invite OpenTAP blog readers and OpenTAP Forum participants to comment on this new capability.